
Creating Maps from Text or Data
Because you’ve been using AI for various tasks at work, you might think you’re ready for an AI-based process mapping assistant. But is AI ready for you?
The answer, of course, is that it depends, partly because of the enormous variety of tools and features that are available.
You’ll find general purpose AI tools that can assist, and you’ll find AI capabilities designed specifically for process mapping. However, it’s early days for this specific use of AI so you’ll need to invest time and use your analysis skills to decide what makes sense for you and your team.
As I’ve explored AI-assisted mapping during the last half of 2025 and the first half of 2026, I’ve looked at three use cases: 1) turning narrative text or structured data into a diagram; 2) creating procedure manuals from existing process maps; and, 3) analyzing an existing map for potential improvements.
In this article we’ll explore use case #1: generating process maps from text and data.
I’ll describe using two general purpose LLMs and then look at the AI capabilities in tools that many of us already use to create process maps.
NOTE: Your mileage will vary! Even if you attempt to replicate my experience, your results are likely to be different. In fact, the same tool has generated different results for me, sometimes minutes later, despite providing it with the same process narrative and initial prompt.
Creating Maps from Text or Data
Because LLMs are generally very good at processing words, they do a nice job of extracting substance from narrative text. The real question is what happens next.
Some systems that use AI to generate diagrams produce editable diagrams that are compatible with popular drawing applications. Others generate images rather than editable diagrams. Yet others generate Mermaid syntax that can be interpreted by other systems to generate diagrams. Some do all three.
In this article, we’ll focus on software that produces editable Visio and Lucidchart diagrams.
NOTE: Refer to the Mermaid section at the end of this article to learn more about Mermaid syntax.
Co-Pilot
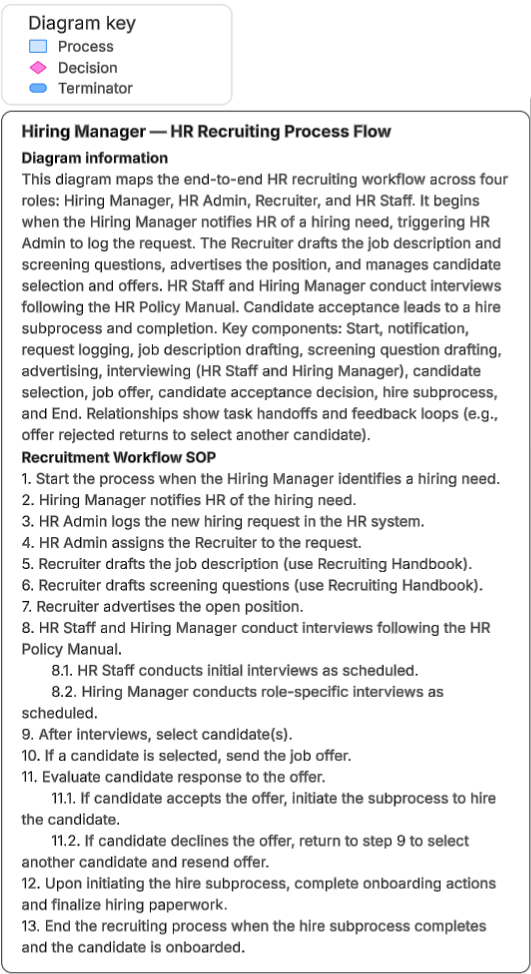
To get started with Copilot, I uploaded a narrative description of a simple HR hiring process and used this prompt:
You’re a business analyst with particular skill at capturing knowledge about and then mapping business processes. Please create a flowchart in Visio for the process described in the attached PDF.
Copilot’s response included a good summary of the process steps in the narrative and generated what it claimed was a valid Visio file. It told me that the diagram contained a blank page and that I would need to use its summary and add and connect the appropriate shapes to create the flowchart.
Not exactly what I had in mind!
In case I didn’t want to create the map by hand, Copilot also asked whether I wanted it to create a “complete, properly laid-out diagram with swimlanes.”
I said yes – and it created a PowerPoint presentation?!?
Once again, not what I had in mind! And definitely not what I asked for at the outset.
I continued conversing with Copilot and it continued to offer detailed instructions for manually creating a Visio diagram, claiming that it would only take me two minutes to do! Here’s an example:
Fastest way to finalize (2 minutes inside Visio)
When you open the file:
- Go to New → Cross-Funcational Flowchart
- Choose:
- Horizontal swimlanes
- Add lanes:
- Hiring Manager
- HR Manager
- Recruiter
- HR + Hiring Manager
- Drag in shapes and use this exact layout:
- Hiring Manager: Start → Request Hire
- HR Admin: Log Request
- Recruiter: Create JD → Advertise Position
- Joint Lane: Conduct Interviews → Decision (Selected?)
Decision Branches
- If No → loop back to interviews
- If Yes:
- Recruiter: Send → Offer Decision (Accept?)
- Yes → Hire (subprocess) → End
- No → Select alternate → Back to Send Offer
- Recruiter: Send → Offer Decision (Accept?)
I would describe these instructions as heading in the right direction but incomplete, especially for someone who is new to creating flowcharts in Visio. Even if you have Visio experience, I’ll let you decide whether you could build this flowchart in two minutes.
Visio Data Visualizer
Before I leave Copilot behind, I should point out that when I told it I couldn’t open the Visio diagram it created, Copilot offered to put the extracted process data into Excel. It said it would format the spreadsheet so it could be used by the Visio Data Visualizer (VDV).
This isn’t a bad idea at all, because Data Visualizer is an excellent way to generate flowcharts and swimlane diagrams from process data in Excel. VDV doesn’t use AI, in part because it was released 10 years ago, but it produces valid Visio diagrams that are synced with the Excel file – you can change the diagram and it updates the Excel data, or you can add, edit, and delete process data in Excel and then have it refresh the diagram.
If you haven’t tried Data Visualizer, it’s worth exploring. To supplement the Microsoft help text linked above, here’s a LinkedIn article I wrote about VDV and my LinkedIn Learning course on the subject.
Final note: the first Excel file generated by Copilot for use by VDV was incorrectly formatted. After several additional iterations, including uploading a properly formatted Excel file as an example, this method produced a valid, usable Visio process map.
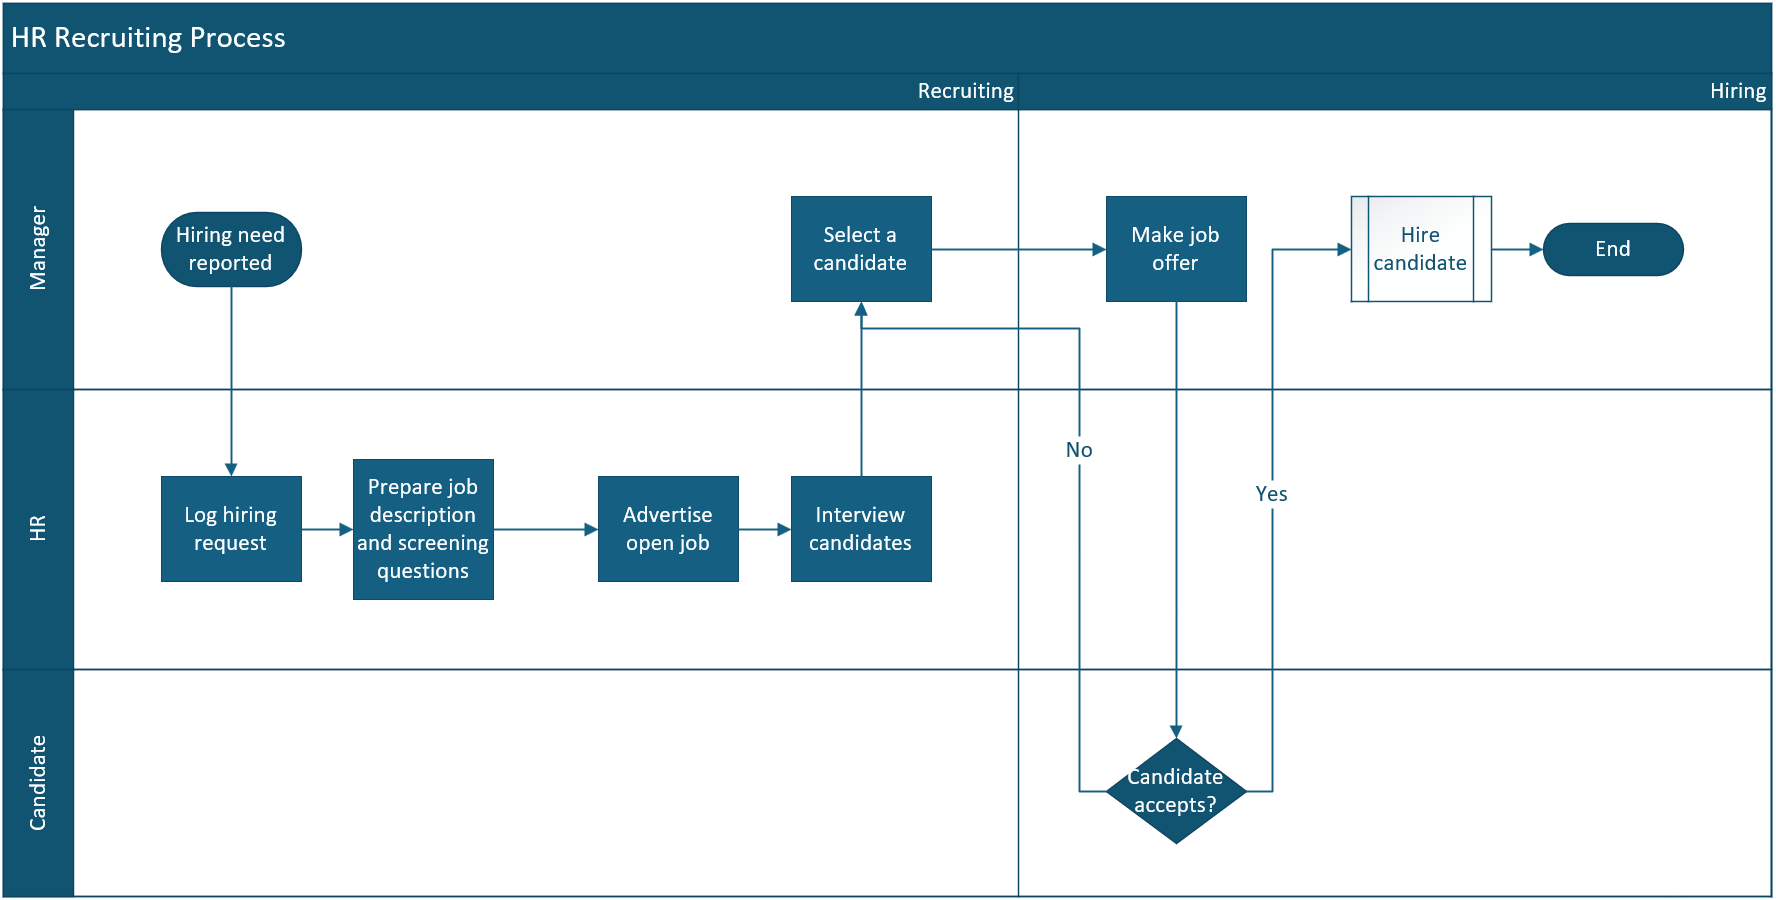
Here’s an example of a swimlane diagram that Data Visualizer created for the HR process:
Claude
I provided the identical narrative document and instructions to Claude and it also struggled to create a valid Visio diagram. For that reason, I decided to switch gears and ask Claude whether it could create a process map using Lucidchart instead.
I had a second reason for switching to Lucidchart: I know that Lucid has built a connection between Claude and Lucidchart using the Model Context Protocol (MCP). (NOTE: The MCP connection also makes Lucidchart available in other LLMs, including Copilot and ChatGPT.)
I configured Claude to use Lucid’s MCP connection and asked Claude to create a diagram in Lucidchart. It did, and it provided a link that opened the new flowchart in my Lucidchart account. The connectors in the flowchart didn’t have directional arrowhead and the “no” path from the decision was missing, but it was a valid, editable Lucidchart diagram.
I asked for a couple of corrections and received them, but still wasn’t satisfied, so I switched gears again: I decided to use Lucid’s AI capabilities from inside Lucidchart rather than from Claude.
Lucidchart without the Process Agent
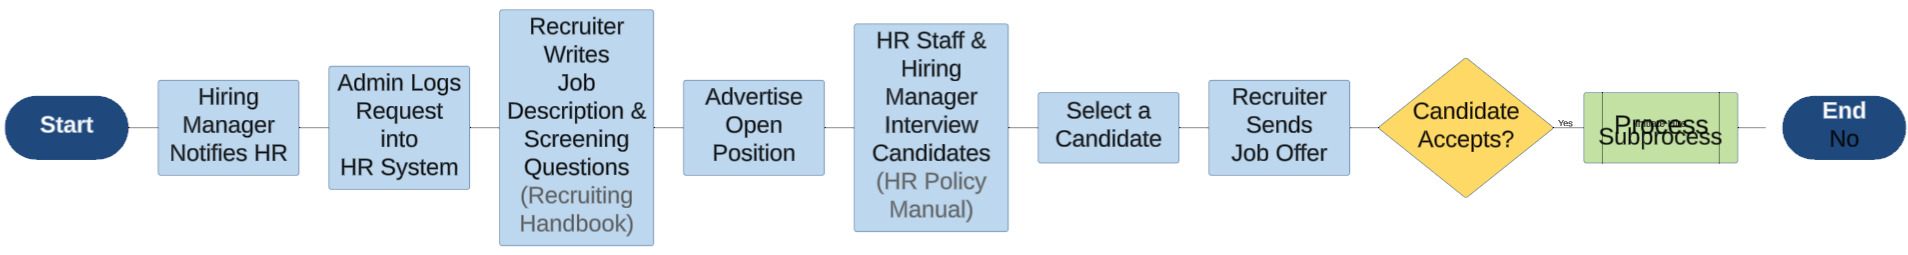
Lucidchart offers AI-generated diagrams of various types including process diagrams. For example, here’s a swimlane diagram of the same HR process generated by the AI capabilities that have been available in Lucidchart for several years:
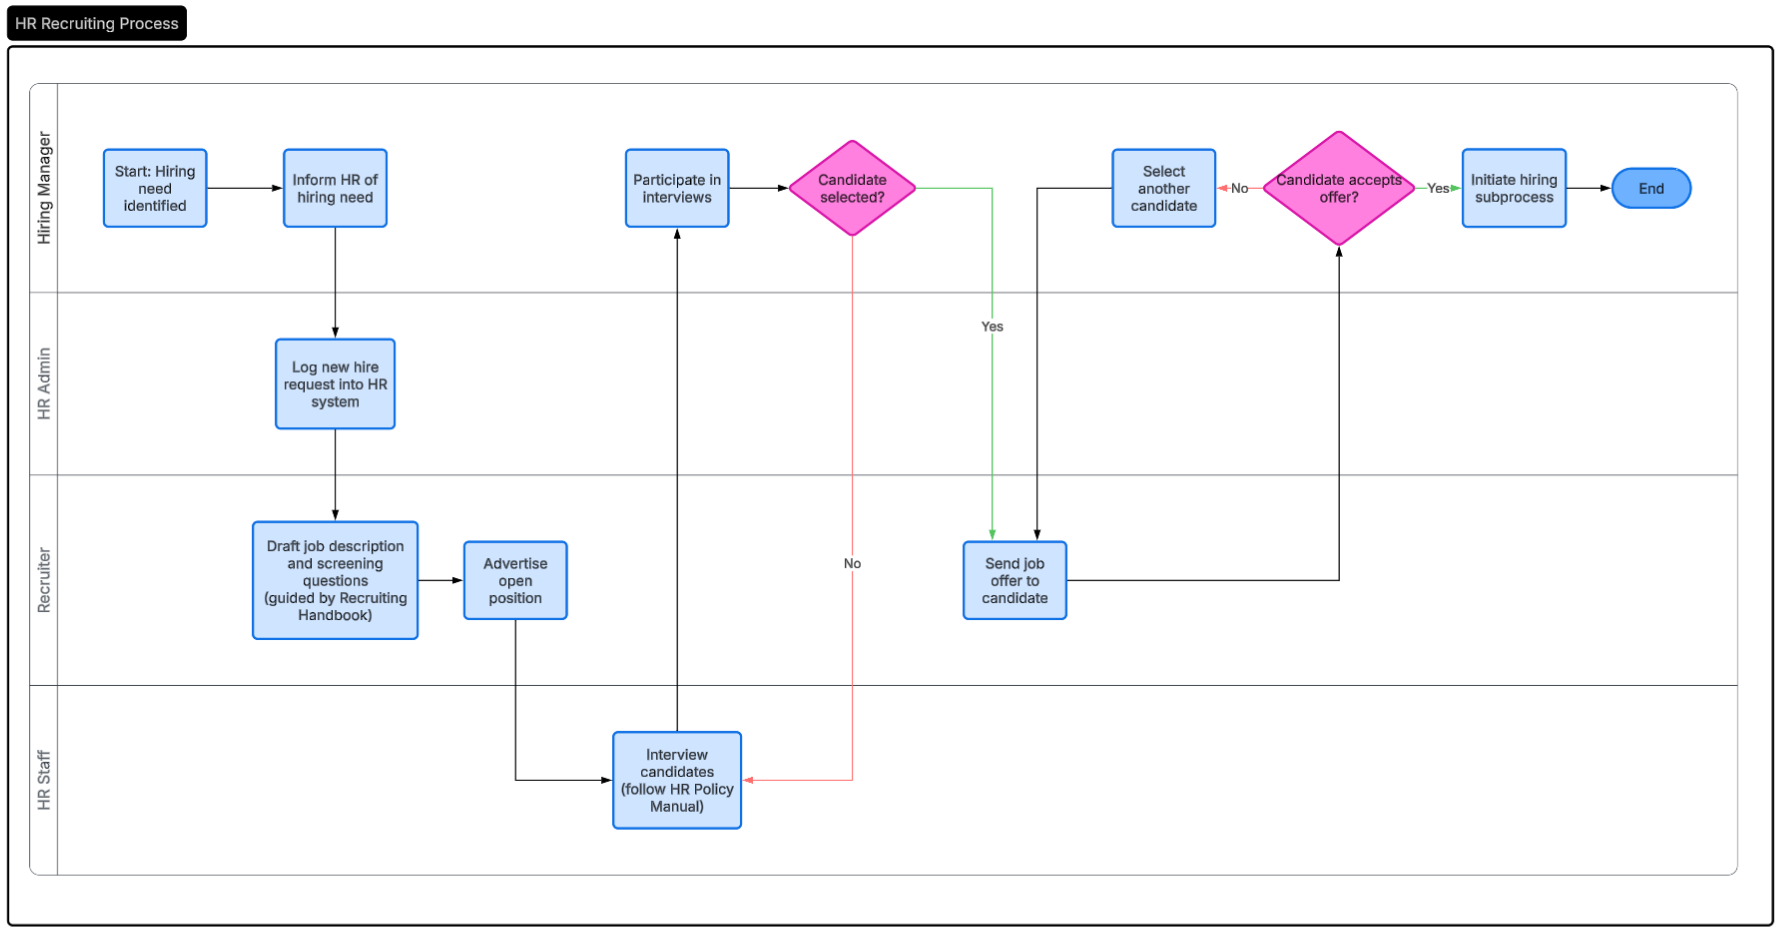
The resulting diagram is quite a bit better than the ones generated from within Claude: the interpretation of the narrative is more complete; the layout is cleaner; and the diagram utilizes a Lucidchart feature that employs both color and line types to differentiate the Yes and No outcomes for decisions.
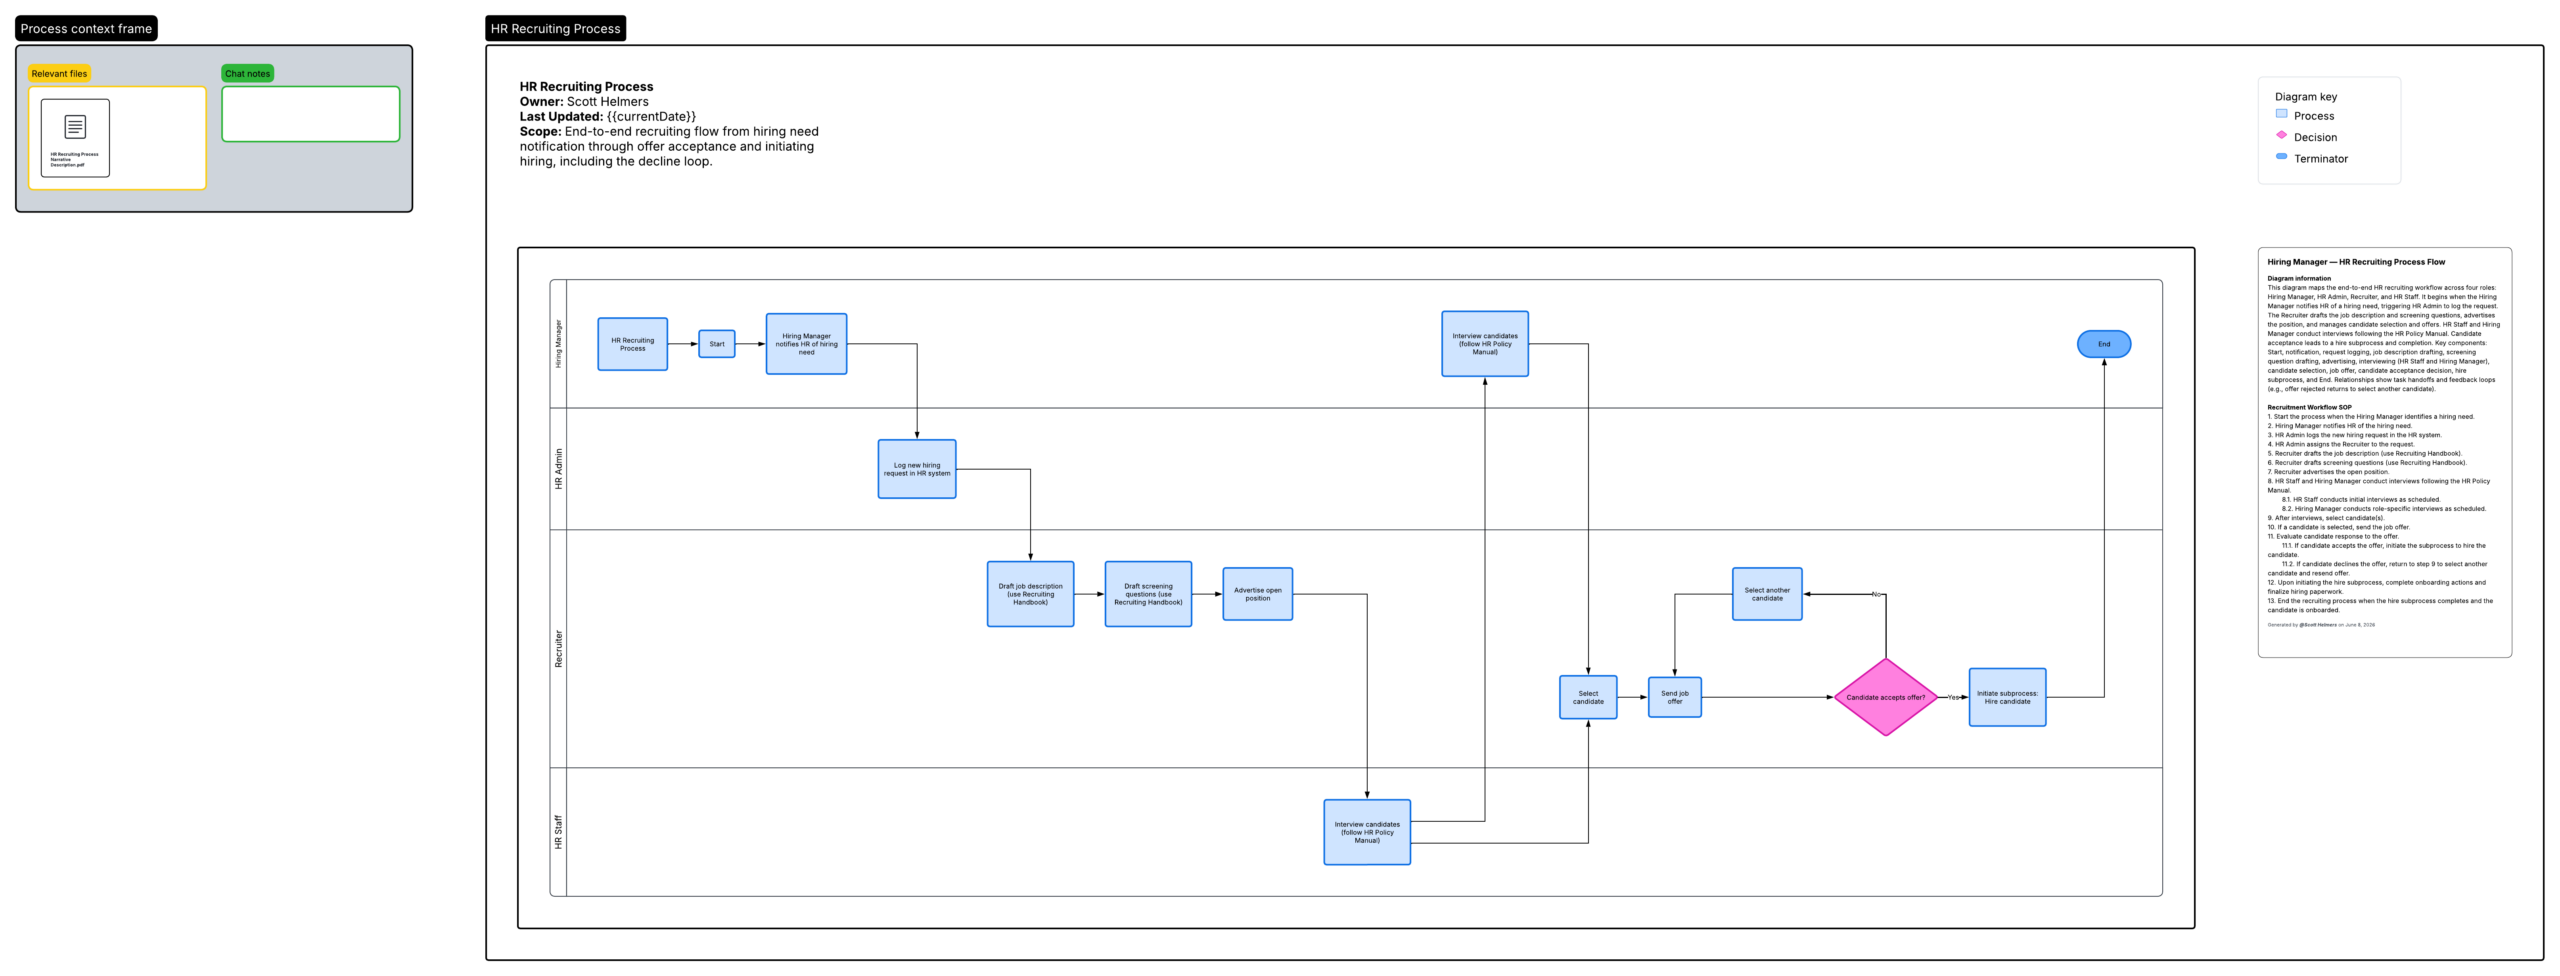
Lucidchart with the Process Agent
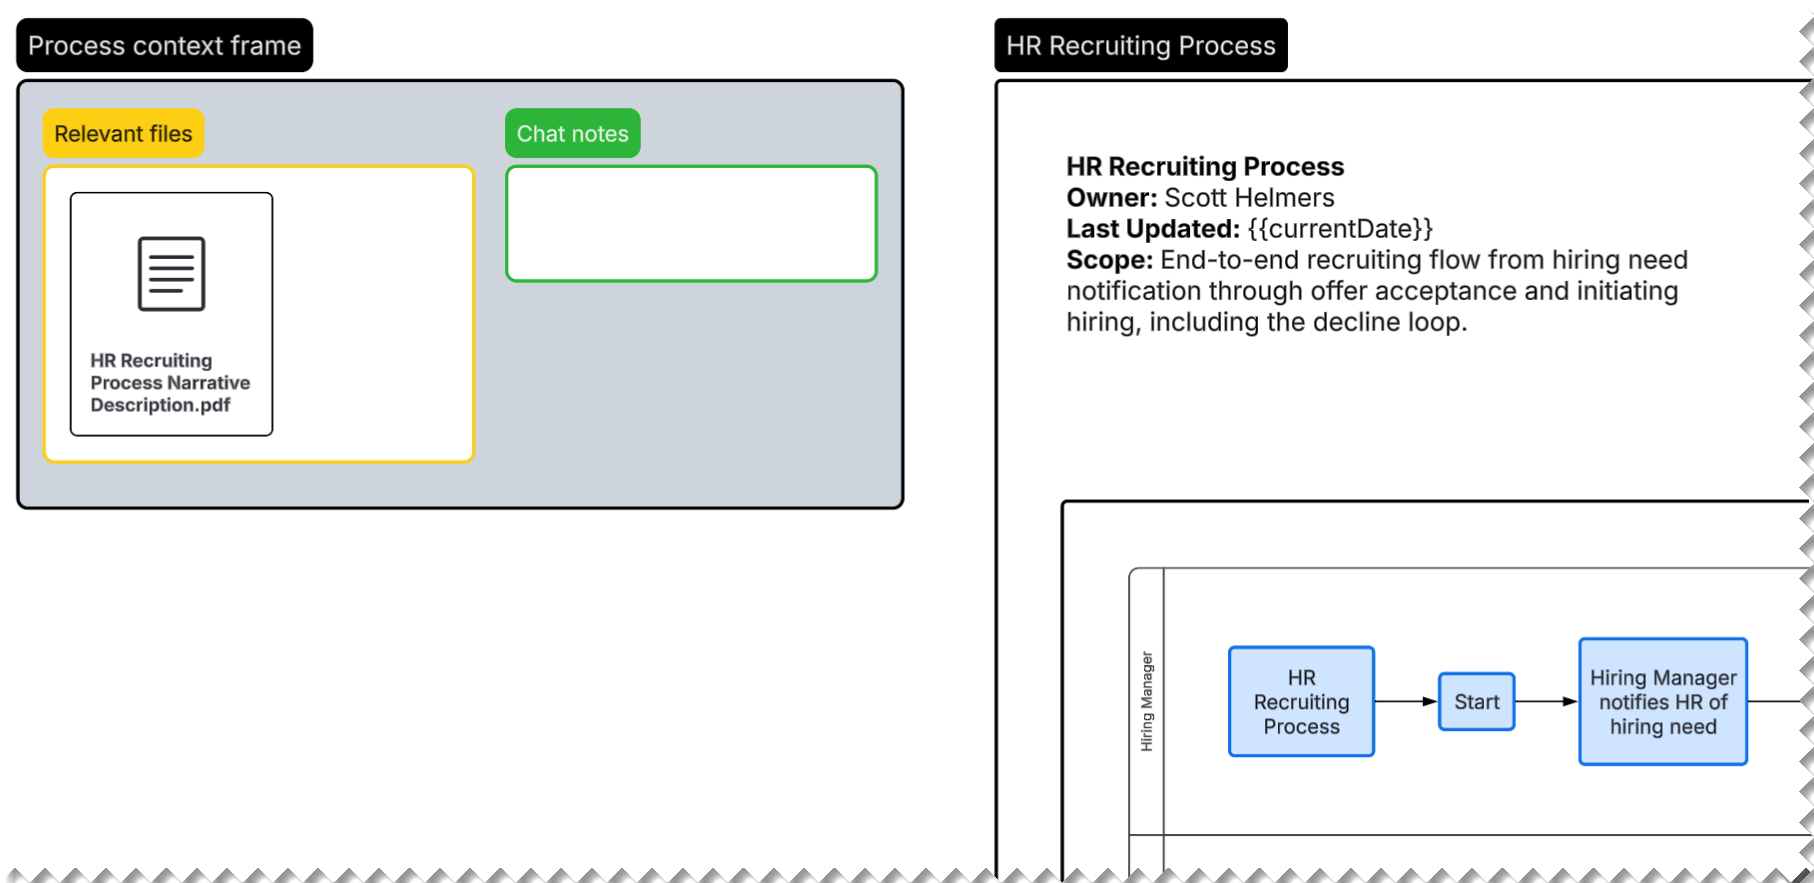
Recognizing the importance of process maps to Lucidchart users, the company has introduced several AI features designed specifically for working with process maps. The Process Agent, now available in a beta version, performs deeper analysis and provides extra features in the output.
For example, flowcharts generated by the Process Agent include a context box that links to the source document(s), and a process summary in the upper left corner of the generated diagram:
The Process Agent also generates a diagram key (always a good choice!) and a detailed process summary:
Mermaid
Mermaid is text-based syntax used to describe various types of diagrams, including flowcharts, such that software can create diagrams from the text. There’s a helpful overview at Wikipedia and a syntax reference along with additional information at the website of the company that is commercializing Mermaid.
Conclusions
If you haven’t explored using AI to generate process maps, it’s a good time to start. I’ve discussed Visio and Lucidchart in this article, but many other diagramming tools include AI capabilities. You’ll find AI features in ProcessPro, Creately, draw.io, Miro, and many more.
Based on my experience, I recommend starting your experiments with a diagramming tool rather than with general purpose LLMs.
And as always when working with AI, don’t take AI-generated maps at face value. Use your analysis skills to question the layout; validate the descriptions placed on the process, decision, and other shapes; verify the sequencing; and most of all, take a step back to decide whether the generated map does the best possible job of describing and presenting the target process.
− Scott

Scott Helmers
Sr. Instructor
Scott Helmers has delivered conference presentations, corporate training, and LinkedIn Learning courses to more than 400,000 people worldwide. He is the Founder and Lead Consultant at Process and Data Design Services, LLC, a firm that offers business process and data visualization solutions. Scott is a co-inventor of TaskMap, a Visio add-in that allows anyone to document, analyze, and improve their business processes. He’s worked with clients in ten countries on projects involving process mapping and redesign, data visualization, knowledge management, and technology training.
Scott has been named a Microsoft Valuable Professional (MVP) for Visio every year since 2008, one of only six people in the world to hold that distinction. More recently he’s become a Lucid Legend, where he focuses on AI-assisted process mapping. He’s created a dozen course for LinkedIn Learning, is the author of four books published by Microsoft Press, and wrote a textbook for Prentice Hall.