

There’s a lot of terminology floating around out there relating to data analysis. What’s a data analyst? What is data analysis? Is that different from data analytics? Where does business analysis fit in?
Unfortunately, a lot of these terms get used interchangeably. That’s compounded by the fact that there’s a lot of overlap between the various fields and roles. And to add to the confusion, those of us who typically focus on business analysis are increasingly being asked to take on expanded roles with data analytics. So who’s who and what’s what?
If you’ve been in one of my classes, you know that I am a huge fan of developing (and using!) a glossary. Let’s take some time and see if we can distinguish between the different disciplines and roles.
Business Data Analysis vs. Data Analytics
Traditionally, the practice of business analysis has included data analysis. I’m going to qualify the term “data analysis” and refer to it as “business data analysis”. Business data analysis ensures that we identify and define all the data components and data-related business rules that are needed to support a business area in their work. Analysis work in this area typically yields logical data models and other data requirements artifacts that are used to define a solution. For more on this critical task, see Ali’s blog, “4 Step Process to Data Analysis.”
Data analytics fills a different need. Data analytics is the process of turning raw data into insights to inform business decisions. There are generally five steps involved in data analytics:
- Define the question
- Collect the data
- Clean the data
- Analyze the data
- Visualize and share your findings
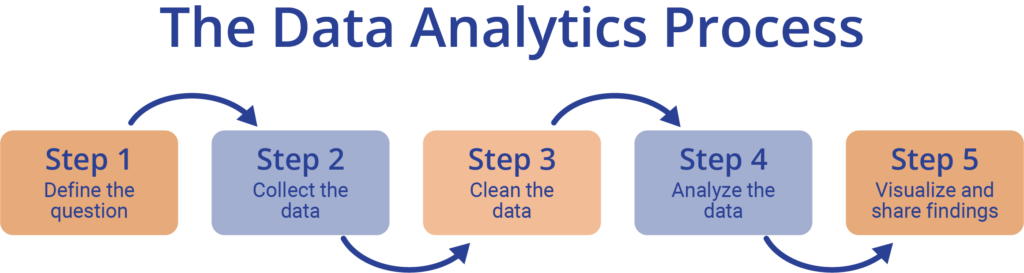
The 5 Steps of Data Analytics
Let’s take a deeper dive into each of the five steps involved in performing data analytics.
STEP 1
Define the Question
STEP 2
Collect the Data
Once we’ve clarified the question, we need to identify that data that is needed to answer it. Some of the data may be quantitative data (like sales figures) and some of it may be qualitative (such as customer reviews). You can use data from one of three sources:
- First-Party Data
First-party data is information that your company has directly collected from interactions with your customers on your own channels such as your website or mobile app.
- Second-Party Data
Second-party data is the first-party data of another organization. As an example, you might buy customer purchase history information that another company has collected on their website or mobile app. - Third-Party Data
Third-party data is data that has been collected and aggregated from numerous sources by a third-party organization. Data aggregators do not collect data directly but obtain it from other companies and compile it into a single dataset. The biggest concern with this type of data is that you do not know where it came from, so it’s difficult to ensure reliability or accuracy.
STEP 3
Clean the Data
- Removing major errors, duplicates, and outliers
- General “housekeeping” such as fixing typos or format issues
- Filling in major gaps if you notice that important data are missing
STEP 4
Analyze the Data
Broadly speaking, data analytics fall into one of four categories:
- Descriptive analysis – identifying what has already happened
- Diagnostic analysis – understanding why that happened
- Predictive analysis – identifying future trends based on historical data
- Prescriptive analysis – making recommendations for the future
These four basic categories are sometimes further decomposed into subcategories. There is a large set of statistical analysis tools that are used in this stage; we review many of them in our “Data Analytics and Storytelling” course.
STEP 5
Visualize and Share Your Findings
The final step of data analytics is to share your insights. All too often analysts approach this step with a “more is better” mentality and do a “data dump” on their audiences. Like it or not, most decision-makers don’t want to wade through pages of numbers and statistics. You need to develop a data “story” that will capture your audience’s attention and clearly communicate your findings.
During this step, be sure to be forthcoming about any gaps in your data or any ambiguity in the conclusions. Honest communication is a very important part of the process.
Business Analyst vs. Data Analyst
Generally, I try not to get hung up on titles. I prefer to talk about “business analysis” instead of “business analysts” because so many people do the work but don’t have that specific title. For the sake of clarity in this article, though, I’m going to revert back to using titles.
Having established that caveat… who does all of this, a data analyst or a business analyst?
If I had to develop a black and white description of who does what at each step along the way, it would look something like this:
Data Analytics Step
Data Analyst
Business Analyst
Define the question
Is often given a question or problem to pursue
Works closely with the business to define the problem to solve
Collect the data
Physically collects and aggregates data from numerous sources
Assists in identifying data that is most relevant to the identified problem. May perform data collection for some projects.
Clean the data
Can work with very large and “dirty” datasets
May need assistance with more complex datasets or combining numerous datasets
Analyze the data
Analyzes complex datasets to identify patterns and trends
Uses analytical skills to interpret data and provide insights that inform decision-making
Visualize and share your findings
Provide analytical results in summarized form
Presents results and recommendations specifically tailored to the business audience
Step 1: Define the Question
Data Analyst: Is often given a question or problem to pursue.
Business Analyst: Works closely with the business to define the problem to solve.
Step 2: Collect the Data
Data Analyst: Physically collects and aggregates data from numerous sources.
Business Analyst: Assists in identifying data that is most relevant to the identified problem. May perform data collection for some projects.
Step 3: Clean the Data
Data Analyst: Can work with very large and “dirty” datasets.
Business Analyst: May need assistance with more complex datasets or combining numerous datasets.
Step 4: Analyze the Data
Data Analyst: Analyzes complex datasets to identify patterns and trends.
Business Analyst: Uses analytical skills to interpret data and provide insights that inform decision-making.
Step 5: Visualize and Share Your Findings
Data Analyst: Provide analytical results in summarized form.
Business Analyst: Presents results and recommendations specifically tailored to the business audience.
Now, having said all that, I’ve seen some “business analysts” who have mad data skills (like my colleague Ali Cox!). I’ve also seen some “data analysts” who are very in tune with their business partners and who can collaborate with them to formulate problem statements and develop business insights. That means the answer to “Who does this?” is the classic business analysis answer: “It depends”! I would never want to hear the dreaded “that’s not my job” comment from a business analyst when asked to dig into business data.
I personally love working with numbers and data. Playing around in Excel makes my heart happy. If you share that joy, or if you want to expand your skills in the area of Data Analytics, our “Data Analytics and Storytelling” course may be just the thing for you.
Analytically yours,
-Kathy
P.S. Spoiler alert… I really do give out gold stars in class if you remember to use the glossary!


Kathy Claycomb
Managing Partner, Lead Expert
Kathy Claycomb brings over 35 years of experience to the classroom. She has participated in all phases of solution development using everything from agile to waterfall methodologies (and quite a few in between). Before joining B2T, her career spanned roles from application developer to Senior Director of Services at various organizations. Kathy has broad industry background including transportation, manufacturing, insurance, energy, healthcare, and banking.
Kathy’s first love is teaching, and throughout her career she has always managed to spend a portion of her time instructing. She has an engaging, highly interactive teaching style that ensures students leave the course with a thorough grasp of the material. Her students consistently praise her teaching abilities and her talent for drawing on her personal experience to enhance their learning.
Kathy served as the Technical Editor for Business Analysis for Dummies, 2nd Edition.